Skip to content
  • Maak een support ticket aan
  • Probeer Zoho CRM gratis uit
  • Banen bij Salesbridge
  • Linkedin
  • Facebook
  • Twitter
SalesBridge
  • Nederlands
  • Home
  • Nieuws
  • Zoho
    • Over Zoho
    • Zoho CRM
    • Zoho Creator
    • Zoho applicaties
    • Integraties
    • GRATIS Zoho Webinar
    • Companyweb
    • Twikey voor Zoho Books
  • KMO Portefeuille
    • Advies
    • Opleidingen
  • Over ons
    • Ons team
    • Careers
    • Reviews
  • Get me started!
  • Contact
  • Careers

Dag: 11 januari 2018

Nieuw: Map Charts voor Zoho Reports
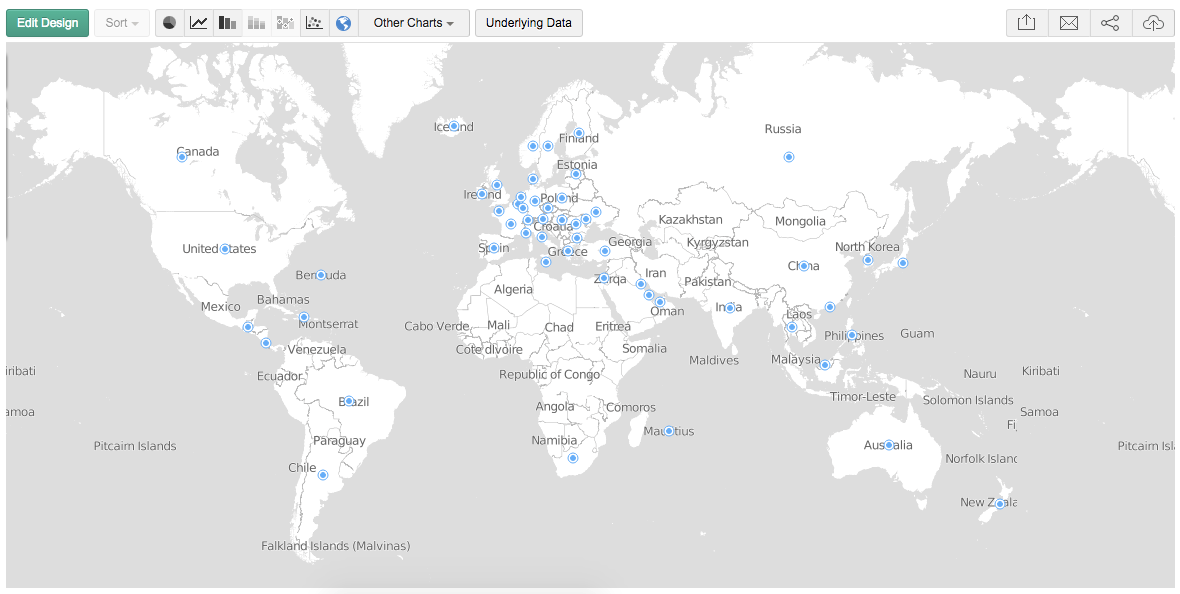
Business Intelligence CRM Industry News Tools Visualisatie Zoho Zoho Analytics Zoho CRM

Nieuw: Map Charts voor Zoho Reports

1. Wat is een Map chart? Een map chart is een kaart van de wereld, continent of een land met gegevens over specifieke regio’s.  De gegevens worden gevisualiseerd als zogenaamde ‘markers’ (puntjes of bubbels) op…

by Karl
11 januari 2018
chat_bubble_outline0
Tags: BI, Charts, Geo data, Maps, visualisatie
Read morearrow_forward

Taal / Language

  • Nederlands

Categorieën

  • Agile
  • Artificial Intelligence
  • Business Intelligence
  • collaboration
  • CRM
  • Data Security
  • GDPR
  • Geen categorie
  • Industry News
  • Integraties
  • IoT
  • Nieuws
  • Operational Excellence
  • Privacy
  • Project Management
  • Sales Automation
  • Sales Management
  • SalesBridge Breaking News
  • Software op maat
  • Tools
  • Visualisatie
  • Workflow Automation
  • Zoho
  • Zoho Analytics
  • Zoho Creator
  • Zoho CRM
  • Zoho Flow
  • Zoho One
  • Zoho Sign
  • Zoho Social
  • Contact
  • Privacybeleid
  • Cookie Beleid
Copyright 2023 All rights reserved by SalesBridge | hello@salesbridge.be
  • Linkedin
  • Facebook
  • Twitter
  • Nederlands